
What the latest NHS hospital figures for England show
Ambulance response times for the most urgent incidents are their quickest in nearly four years.

The NHS has published its latest performance figures for hospitals in England, which show improvements in long waits for treatment and ambulance response times, but a rise in the overall size of the waiting list.
Here, the PA news agency looks at the key statistics:
– Overall waiting list
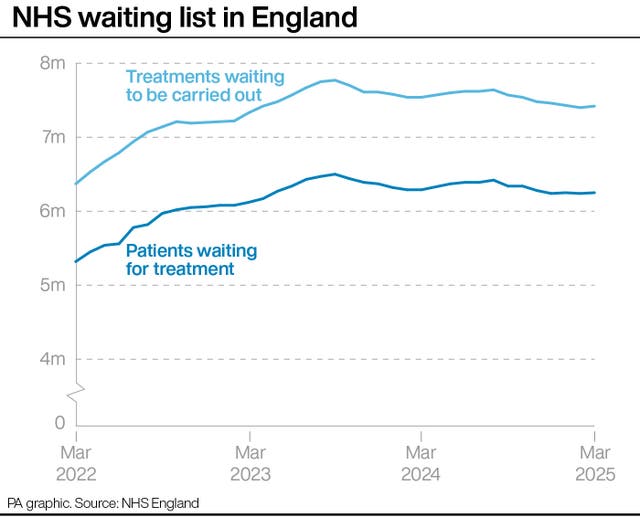
The waiting list for routine hospital treatment in England has risen for the first time in seven months.
An estimated 7.42 million treatments were waiting to be carried out at the end of March, relating to 6.25 million patients.
This is up slightly from 7.40 million treatments and 6.24 million patients at the end of February.
The list hit a record high in September 2023, with 7.77 million treatments and 6.50 million patients.
The size of the waiting list can be affected by seasonal factors – for instance, in the years immediately before the Covid-19 pandemic there was often an increase across the first few months of the year, with more people coming forward for treatment during and after the winter.
In recent years seasonal trends have not been so clear, thanks to the impact on waiting lists of the pandemic and industrial action by NHS staff.
This year, the list fell in January and February but rose in March.
The size of the list has been broadly increasing for much of the last 10 years, passing three million treatments in 2014, four million in 2017, five million in 2021 and seven million in 2022.
In February 2020, the last full month before the start of the Covid-19 pandemic, the list stood at 4.57 million treatments.
– Long waits for treatment
Some 1,164 patients had been waiting more than 18 months to start routine treatment at the end of March, down from 1,691 in February.
A year earlier, in March 2024, the number stood at 4,769.
There were 7,381 patients who had been waiting more than 65 weeks to start treatment, down from 13,223 the previous month.
This figure stood at 48,967 in March 2024.
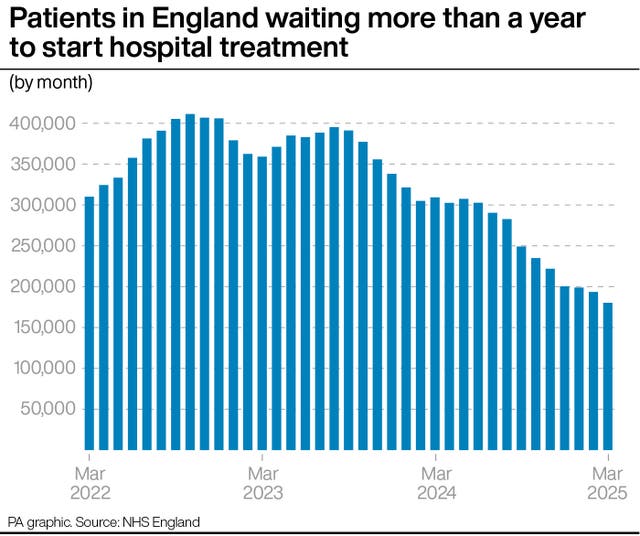
A total of 180,242 people had been waiting more than 52 weeks to start routine hospital treatment at the end of March, down from 193,516 at the end of February and the lowest number since October 2020.
Some 2.4% of people on the waiting list for hospital treatment had been waiting more than 52 weeks in March, down from 2.6% the previous month and from 4.1% a year earlier in March 2024.
The Government and NHS England have set a target of March 2026 for this figure to be reduced to less than 1%.
– Accident and emergency waits
Some 74.8% of patients were seen within four hours in A&Es last month, down slightly from 75.0% in March.
The Government and NHS England have set a target of March 2026 for 78% of patients attending A&E to be admitted, discharged or transferred within four hours.
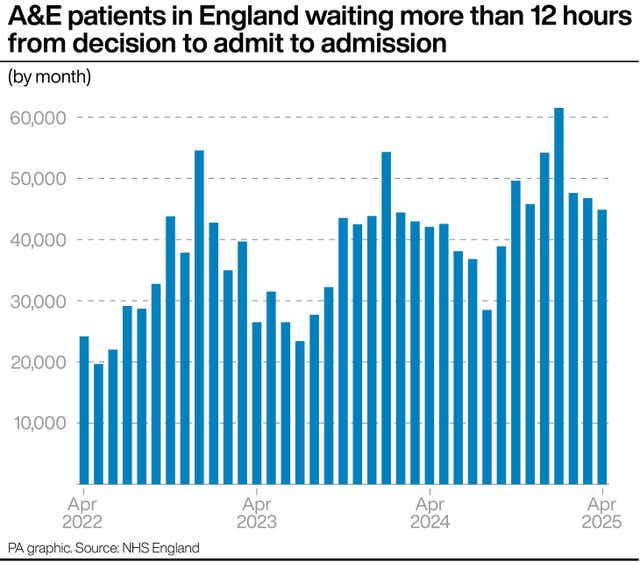
The number of people waiting more than 12 hours in A&E departments in England from a decision to admit to actually being admitted stood at 44,881 in April, down from 46,766 in March.
The number waiting at least four hours from the decision to admit to admission also fell, standing at 132,040 in April, down from 133,957 in March.
– Cancer referrals
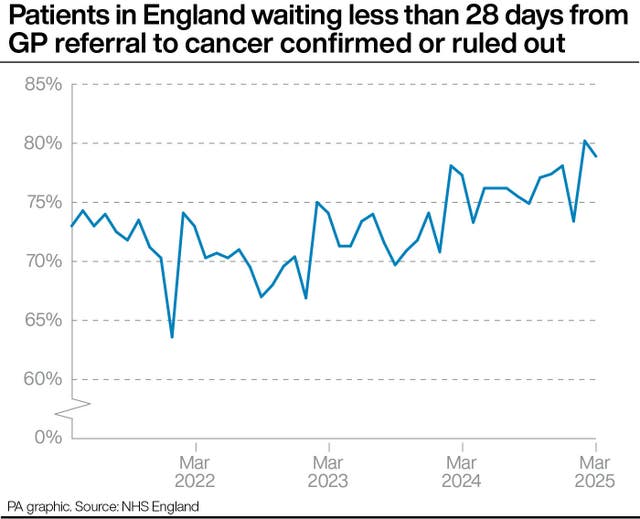
A total of 78.9% of patients urgently referred for suspected cancer were diagnosed or had cancer ruled out within 28 days in March, down from 80.2% in February.
The Government and NHS England had set a target of March 2026 for this figure to reach 80%.
The proportion of patients who had waited no longer than 62 days in March from an urgent suspected cancer referral, or consultant upgrade, to their first definitive treatment for cancer was 71.4%, up from 67.0% and the highest figure since this measure was first reported in spring 2022.
The Government and NHS England have set a target of March 2026 for this figure to reach 75%.
GPs in England made 272,165 urgent cancer referrals in March, up from 252,308 in February and up year-on-year from 255,308 in March 2024.
– Ambulance response times
The average response time in April for ambulances in England dealing with the most urgent incidents, defined as calls from people with life-threatening illnesses or injuries, was seven minutes and 43 seconds.
This is down from seven minutes and 52 seconds in March and is the quickest time since May 2021 – but it remains above the target standard response time of seven minutes.
Ambulances took an average of 27 minutes and 34 seconds last month to respond to emergency calls such as heart attacks, strokes and sepsis.
This is down from 28 minutes and 34 seconds in March.
The Government and NHS England have set a new target for this figure to average 30 minutes across 2025/26.
Response times for urgent calls, such as late stages of labour, non-severe burns and diabetes, averaged one hour, 32 minutes and 34 seconds in April, down from one hour, 36 minutes and 17 seconds in March.
– Diagnostic tests
More than 300,000 people had been waiting longer than six weeks for a key diagnostic test in March.
Some 312,744 patients, 18.4% of the total, were waiting longer than six weeks for one of 15 standard tests, including an MRI scan, non-obstetric ultrasound or gastroscopy.
This is up from 291,346 in February (17.5% of the total) but lower than the figure a year earlier in March 2024, which was 354,940 (21.8%).


